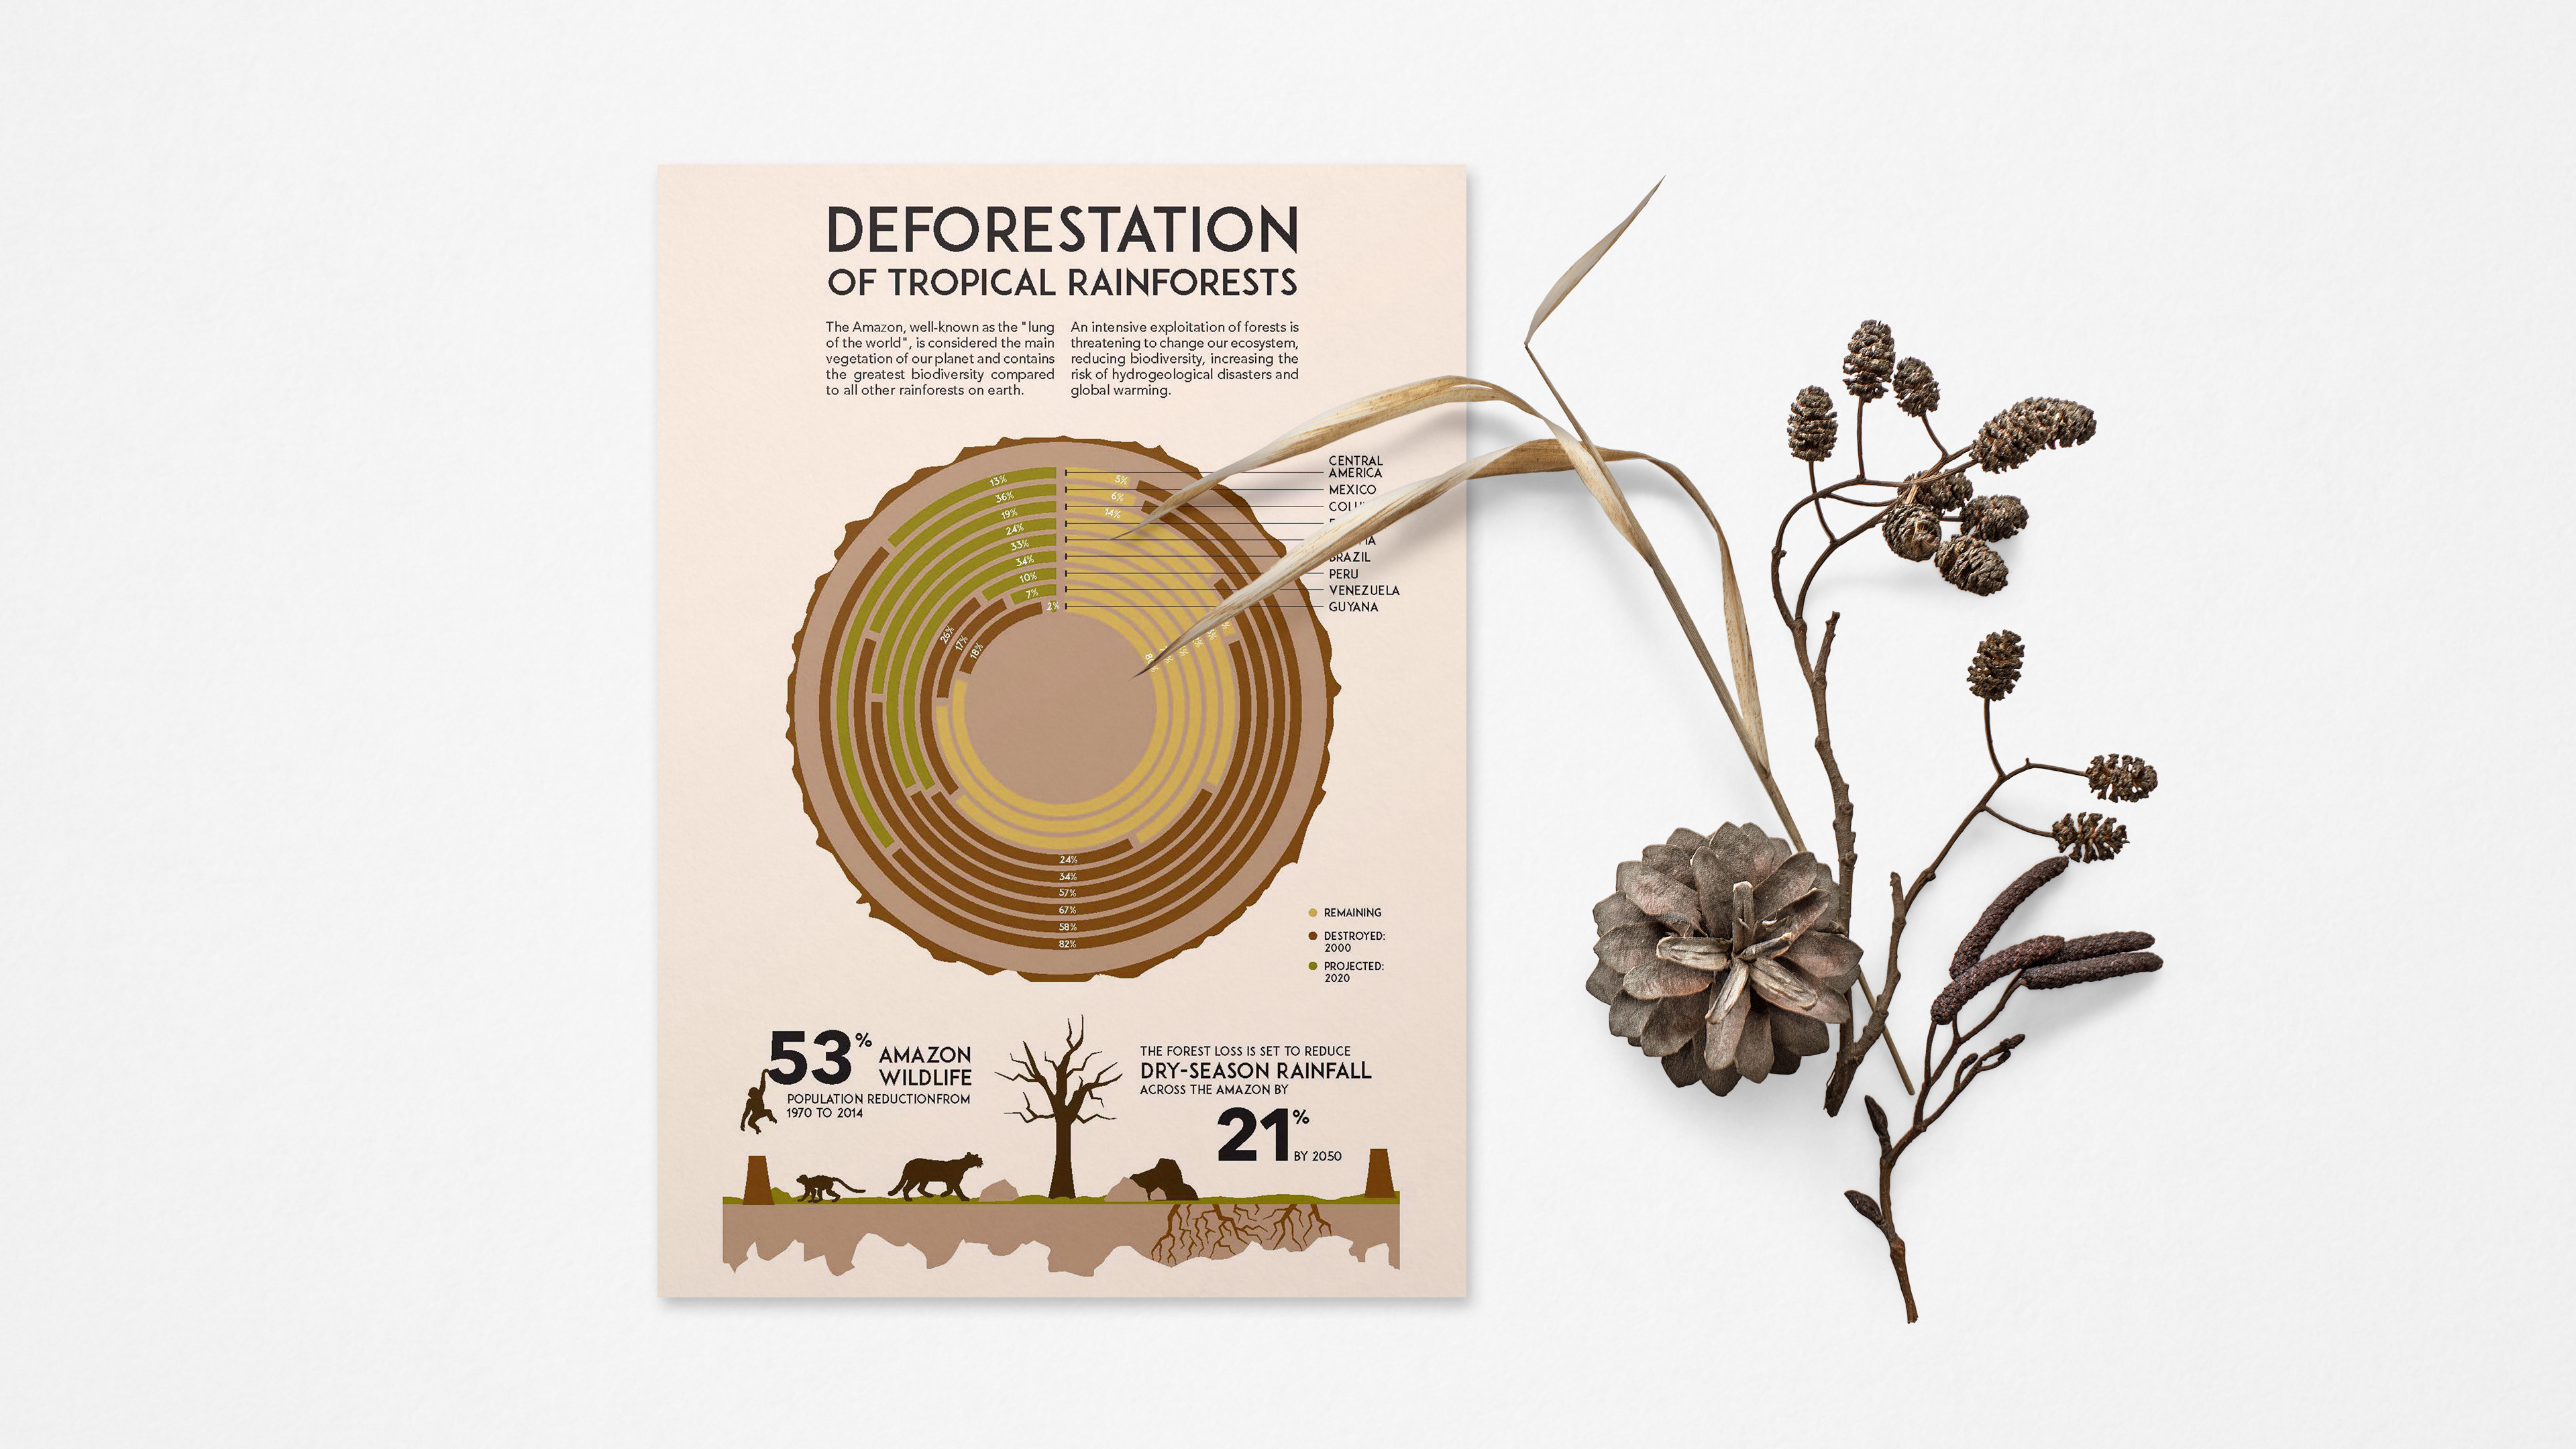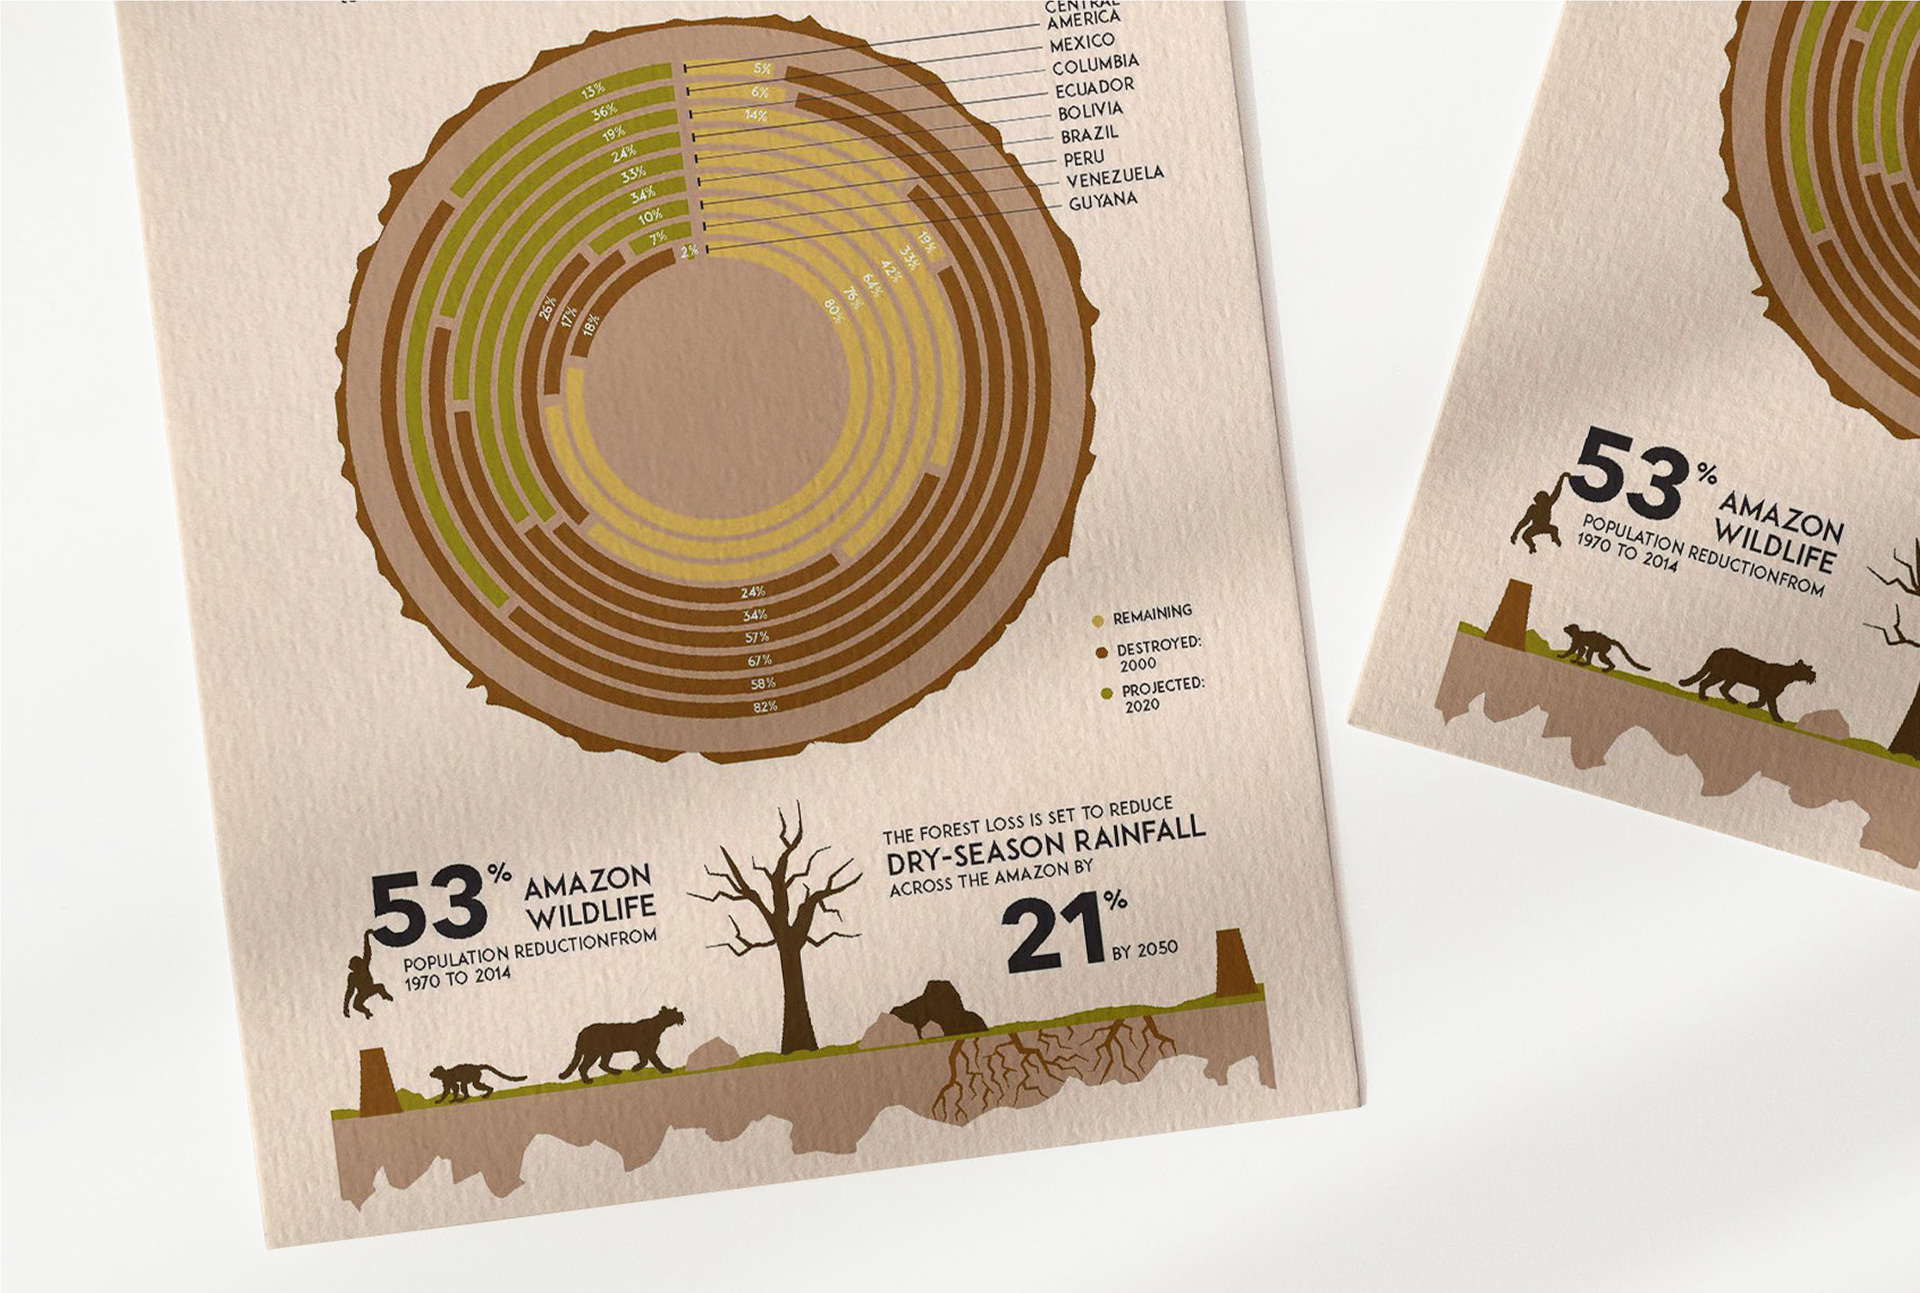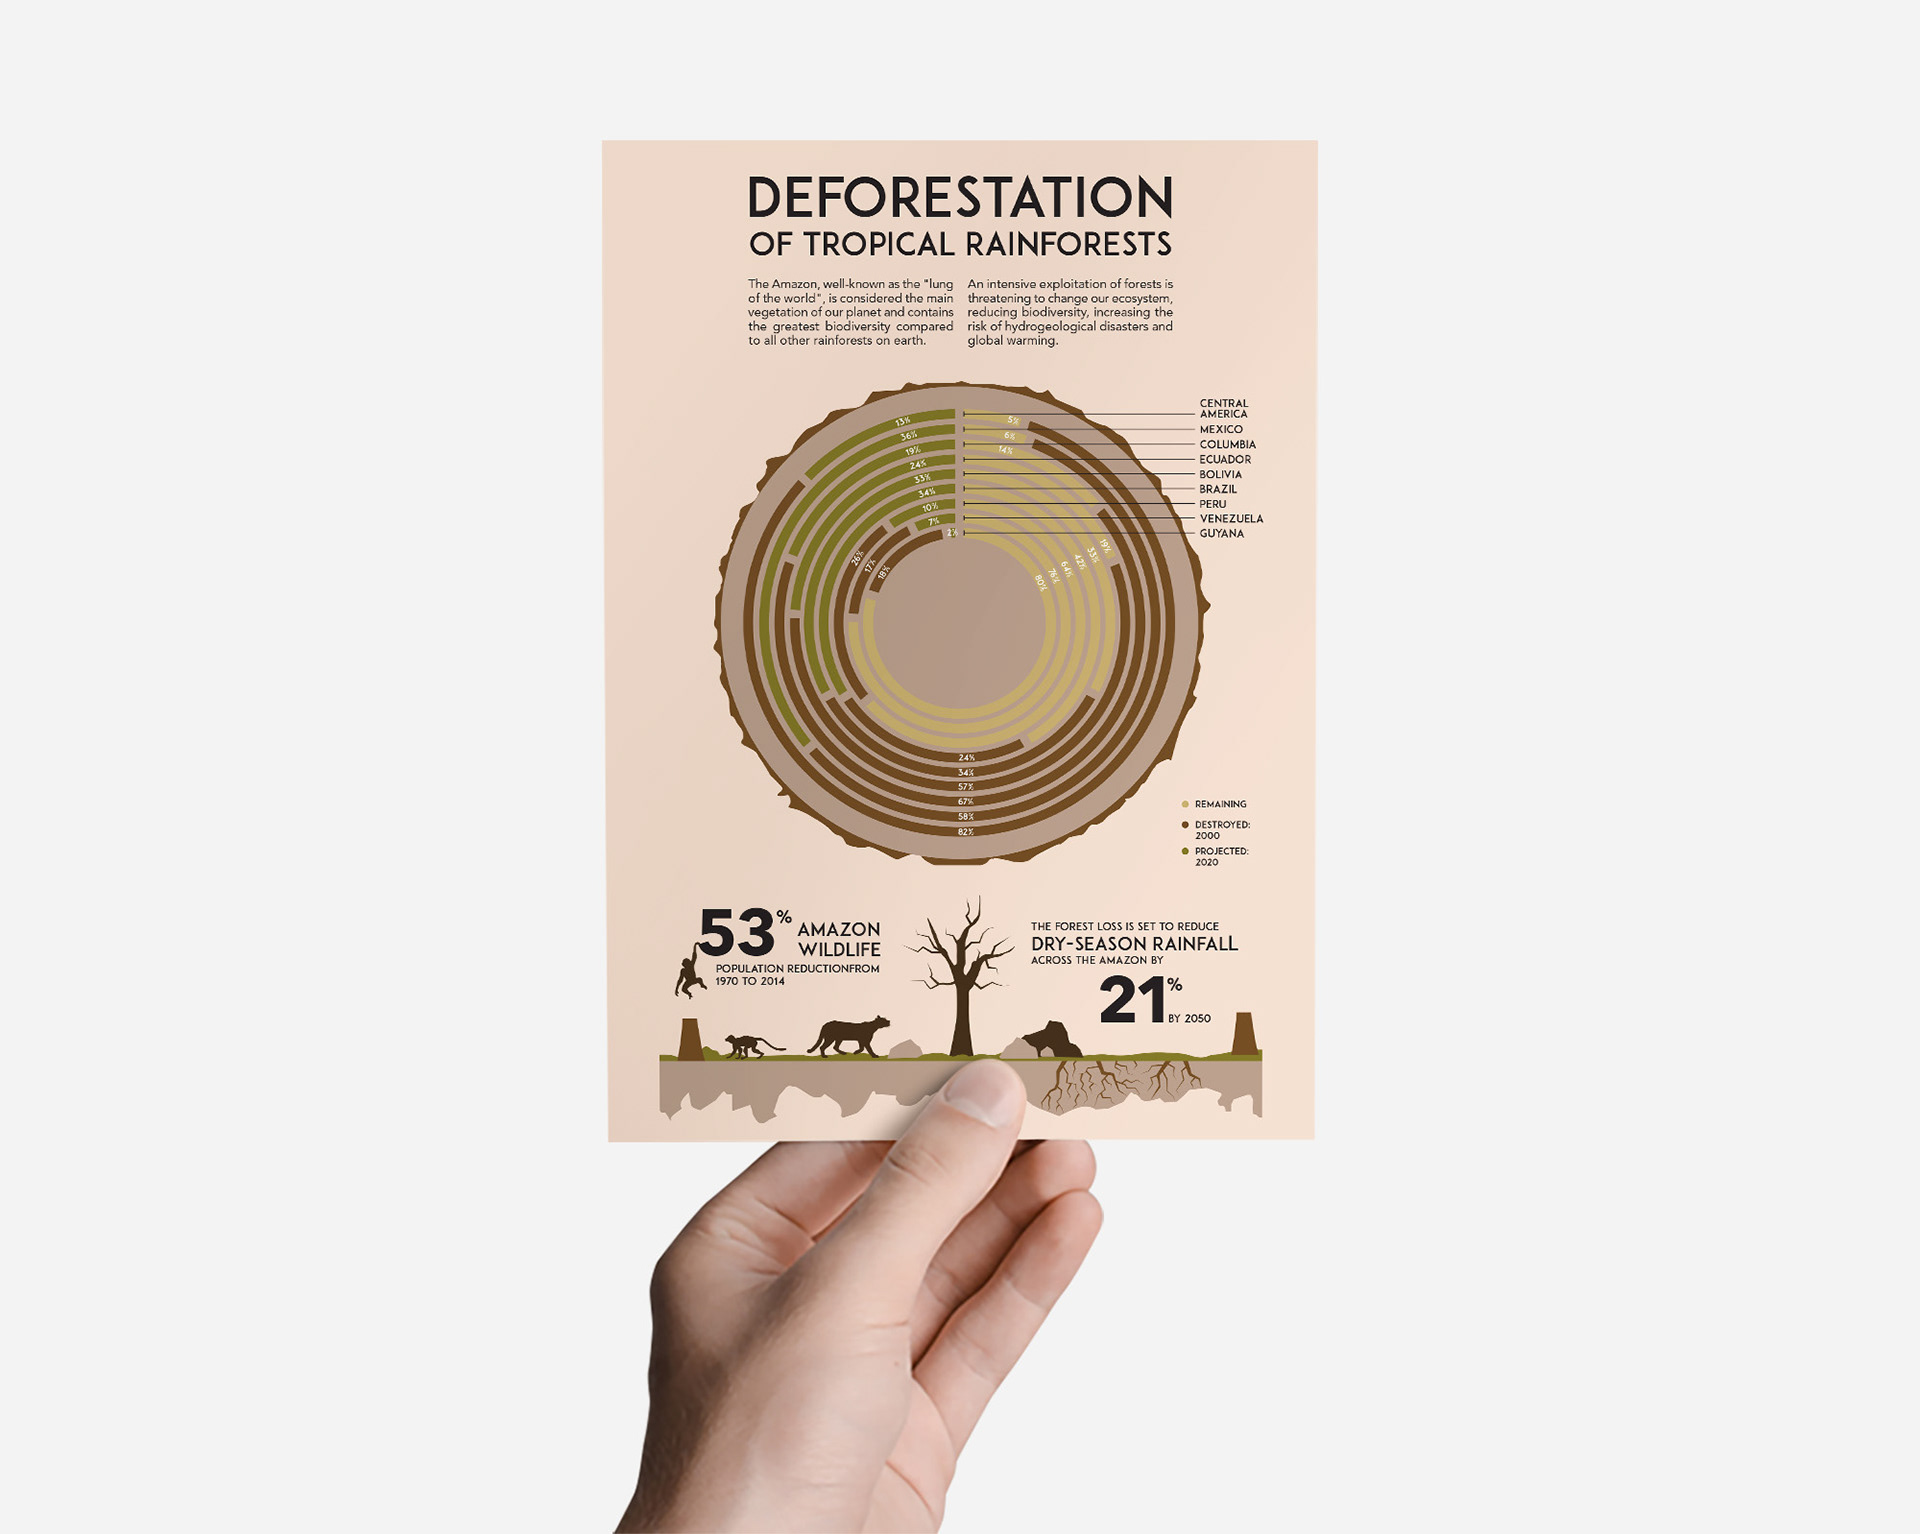
The main goal of this project is to design a visually engaging chart based on the data about the deforestation of Tropical Rainforests and add two additional levels of visual information to enlarge the viewers’ understanding of the issue. The process starts with detailed research about the given topic and a deep exploration of different charts and designs. The idea is to combine the collected data and illustrations to represent the topic in a clear, organized and efficient way.
Causes of deforestation include logging, agriculture, cattle ranching, mining, oil extraction and dam-building. By designing this chart, I decided to focus on the concept of logging, representing an open trunk of a tree, as if it were cut, as the basis for building the data. The latter include the percentages of remaining and destroyed trees and those that are projected for the future, in the countries affected by deforestation. Additionally, the project includes two other levels of information: the first relates to wildlife and the second to dry-season rainfall reductions across the Amazon.
The colours used reflect the main theme of the project: a serious environmental issue that is related to the concept of destruction and death. The sans serif typeface makes the data easy to read and understand. The paper used is environmentally friendly.